Why planning software costs too much (and what to do about it)
Published April 30, 2026 · Updated May 23, 2026
Updated May 2026: EverGantt is now a web app you can use on any browser, this post has been updated to match.
If you’ve shopped for a Gantt chart in the last five years, you’ve probably noticed the pricing falls into two camps, neither of which is great if you’re a freelancer, an indie studio, or a small team that runs a project every few months instead of every day.
This post is a quick category map and an argument for a third option.
Camp one: the heavy desktop suites
A handful of long-running desktop apps still sell as one-time purchases, and they cost roughly $200 to $350 each. They’re feature-dense (earned-value analysis, baselines, leveling, multi-project rollups, AppleScript automation, the whole project-management apparatus) and they’re aimed squarely at people whose day job is being a project manager.
If that’s you, they’re a fine deal. If your day job is “build the thing,” paying $250 to plan a side project is hard to justify.
Camp two: the subscription web apps
Almost every newer entrant ships as SaaS, billed monthly per seat. Prices land between $10 and $30 per user per month, depending on tier. There’s usually a free plan that turns into a paid plan the moment you cross some arbitrary line, three projects, more than five collaborators, the ability to export.
The wedge here is collaboration. Real-time editing, comments, @-mentions, and integrations matter when you have ten people simultaneously dependent on the chart. They matter much less when there’s one person drawing it.
Subscriptions also assume continuous use. The economics break for bursty work, a freelance project every couple of months, a yearly planning sprint, a one-off contract. You end up paying for twelve months of access to use the tool for two.
Camp three: fair, transparent pricing for the 80% case
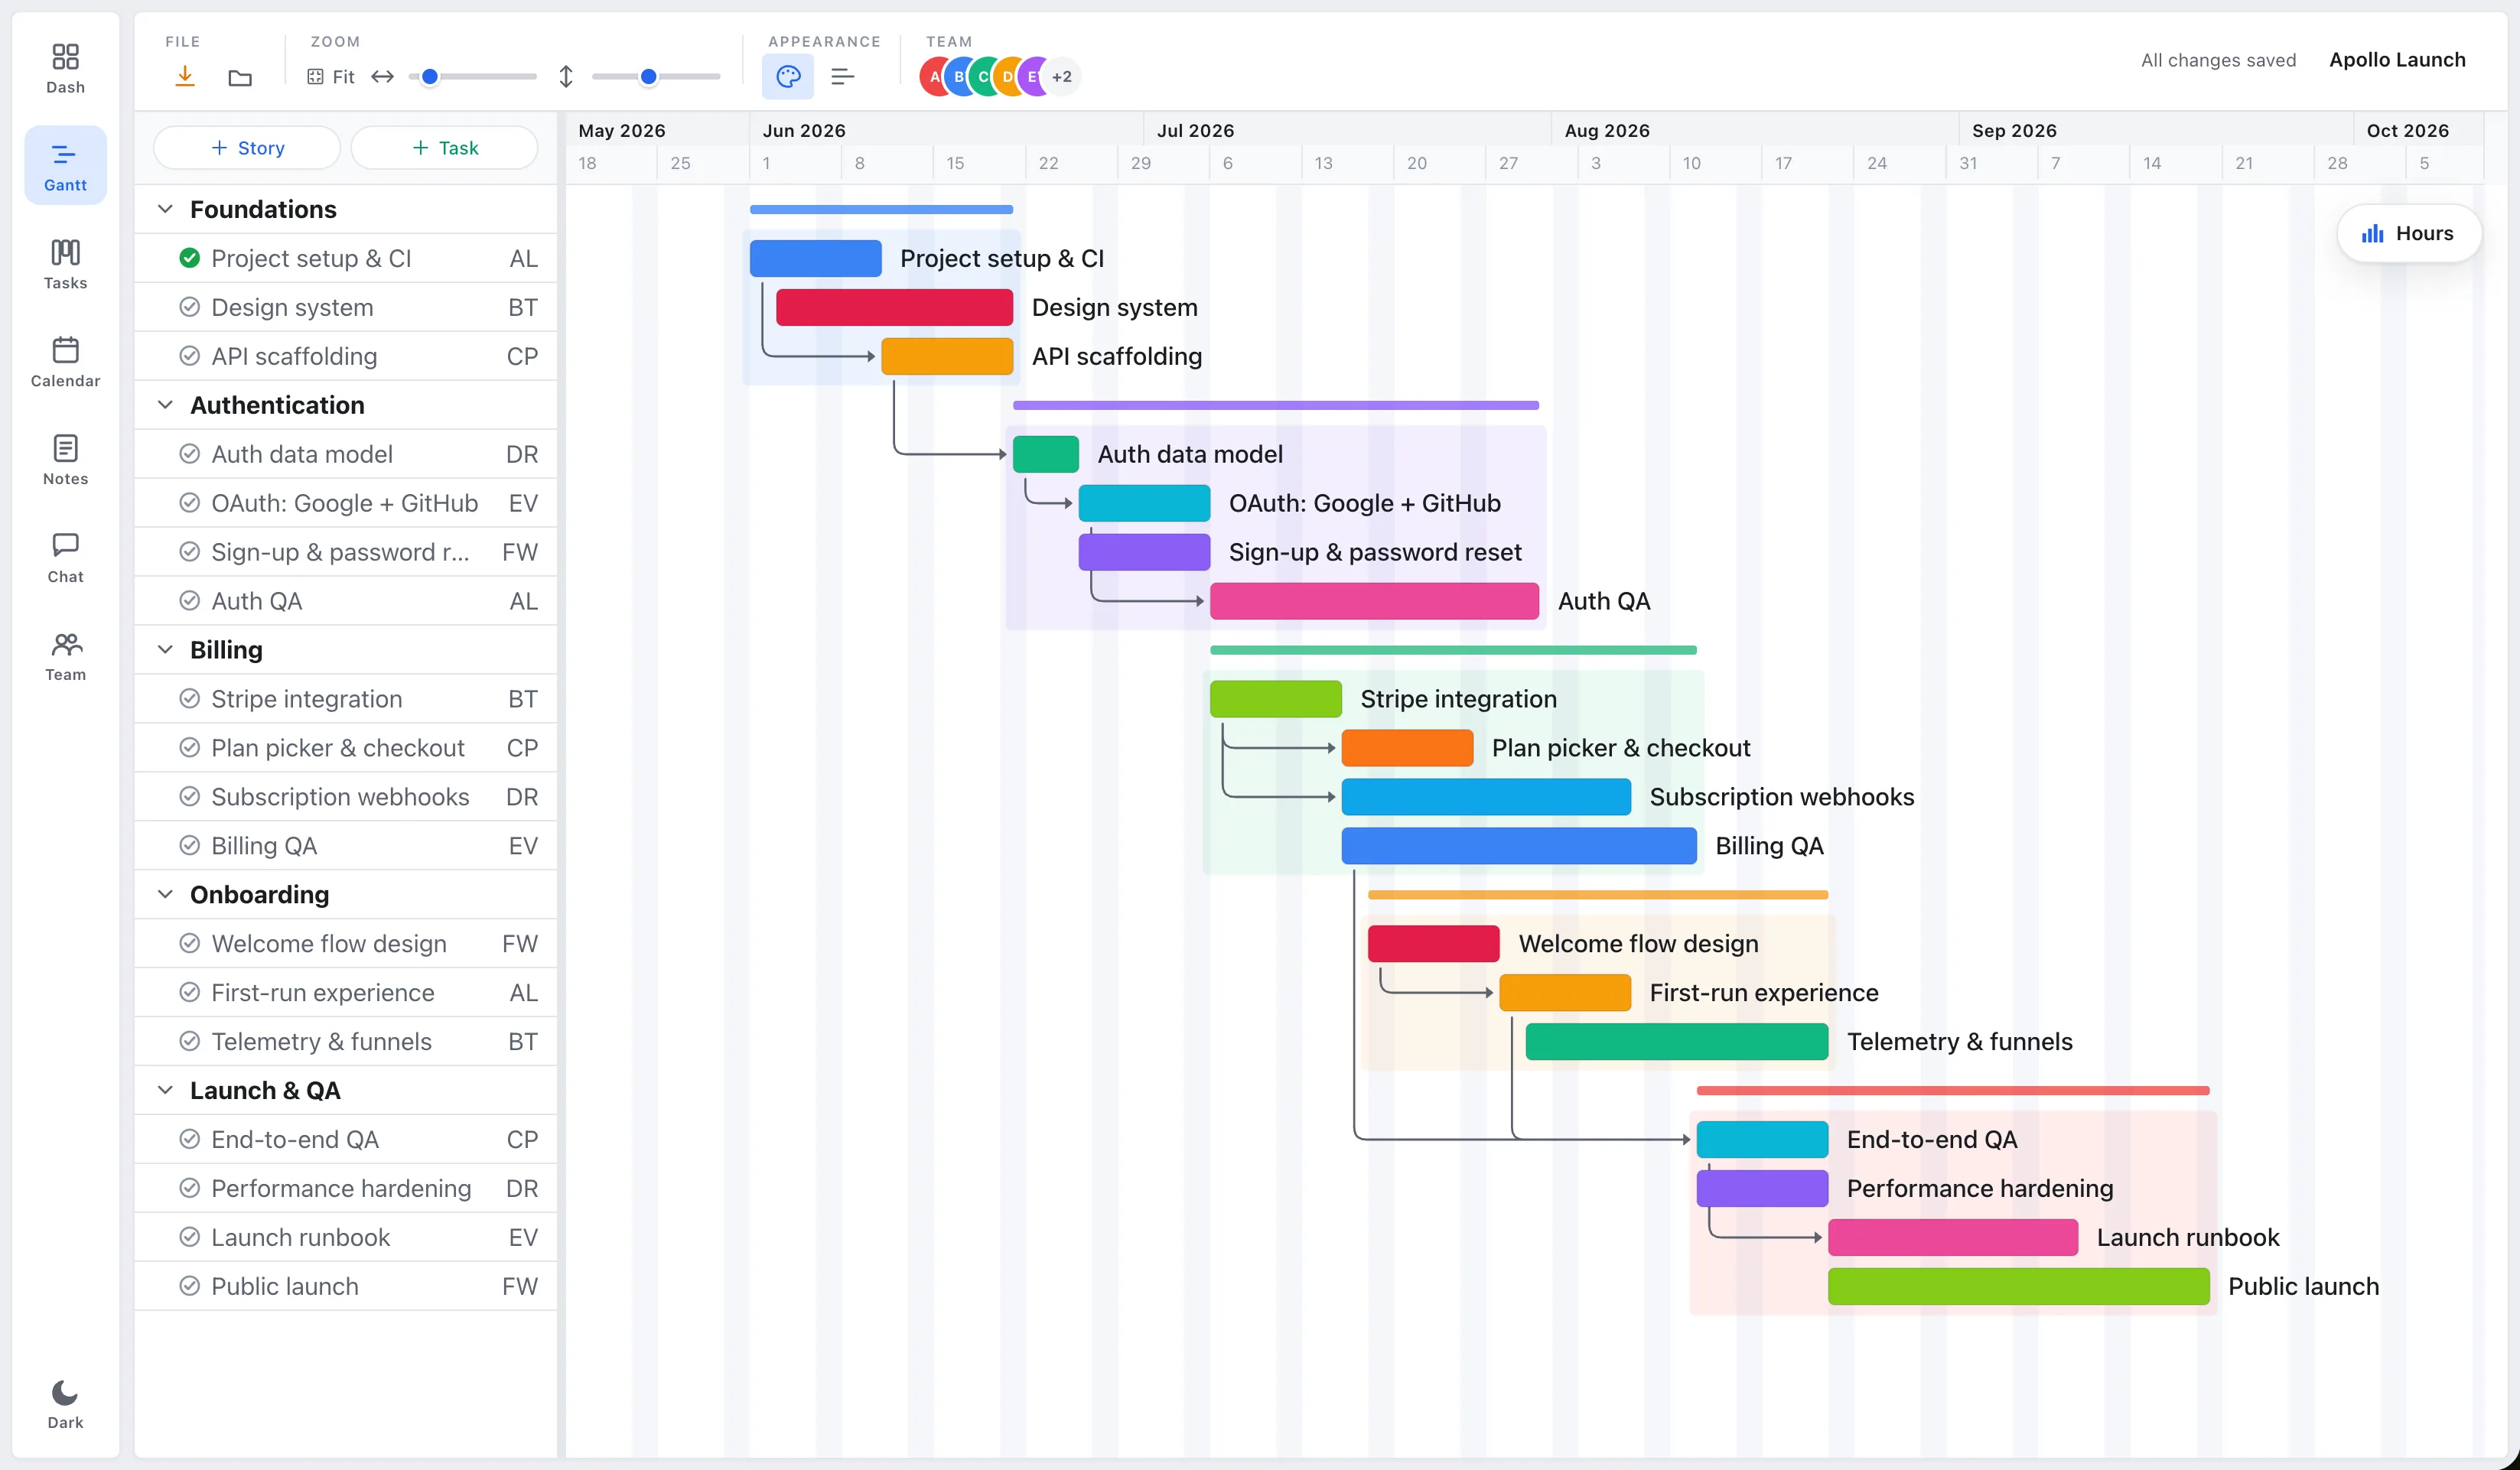
This is the slot EverGantt sits in. The app runs in any browser, no install, no platform dependency, Mac or Windows or Linux. It’s free to build and export: open it right now, draw your chart, export it, and pay nothing. If you want to save projects to the cloud, open them across devices, or invite teammates, that’s $3.99/user/month.
Stories, tasks, dependencies, multi-assignee tasks, and a stacked team-utilization panel. It does the 80% case and not much more.
You give up:
- Real-time multi-user collaboration in the free tier. (Pro invites teammates and enables shared projects.)
- Earned-value reports and PMI-style baselines. (If you need these, the heavy desktop suites are still the right answer.)
You get back a chart that’s priced honestly, low enough that bursty use actually makes sense, with your data always exportable so you’re never locked in.
How to choose
| If you… | What to use |
|---|---|
| …need EVA, baselines, leveling, audit trails | A heavy desktop suite |
| …have 15+ collaborators and a Slack-like dependency on real-time editing | A subscription SaaS |
| …are a freelancer, solo PM, or studio under ~10 people | EverGantt at $3.99/user/month |
| …want a one-off chart for a deck | A spreadsheet template |
There’s no universally “best”, only “best for the next chart you have to draw.” If the next chart is “track a side project for three months,” paying $200 is silly. If it’s “deliver a $2M client engagement on time, with audit-grade reports,” $200 is rounding error.
The hidden tax of “free” tools
Free tools are usually the most expensive over time. They monetize by pulling you into their ecosystem and then charging for export, integrations, larger team sizes, or simply for not having ads in your face during a client call. By the time you’ve built a year of charts in someone’s free tier, you’re locked in, they can raise the price and you’ll pay it because the cost of leaving is higher.
A tool priced honestly from the start can’t pull that move. The economic incentives line up: we keep the price fair, you keep subscribing. If you don’t find it useful, cancel, no contracts, no runaround.
What to expect from EverGantt specifically
It’s $3.99/user/month, with a free tier that genuinely lets you build and export. There’s no bait-and-switch upsell tier. The file format is plain JSON, if we go out of business tomorrow, you can export your charts and rebuild them in another tool. Your data is yours.
If that sounds like the right shape of trade-off, start free in your browser. Related: the best free Gantt chart software for small teams.
Frequently asked questions
Why is most Gantt chart software so expensive?
It falls into two camps: heavy desktop suites at $200–$350 upfront, aimed at full-time project managers, or subscription web apps at $10–$30/user/month that assume continuous use. Both are hard to justify for bursty or small-team work.
What's an affordable alternative to expensive PM software?
EverGantt sits in a third slot, fair, transparent pricing for the 80% case at $3.99/user/month, free to build and export in the browser. It covers stories, tasks, dependencies, and team capacity without the enterprise apparatus.
Why are 'free' Gantt tools often the most expensive over time?
Many monetize by locking you into their ecosystem, then charging for export, integrations, or larger teams. After a year of charts in a free tier, the cost of leaving is high enough that you'll pay whatever they raise the price to.
Will I lose my data if I stop paying for EverGantt?
No. The file format is plain JSON and your data is always exportable, if you cancel or the company disappears, you can export your charts and rebuild them in another tool.