
How to export a Gantt chart as PNG, PDF, or SVG for free
Published September 22, 2026 · Updated September 23, 2026
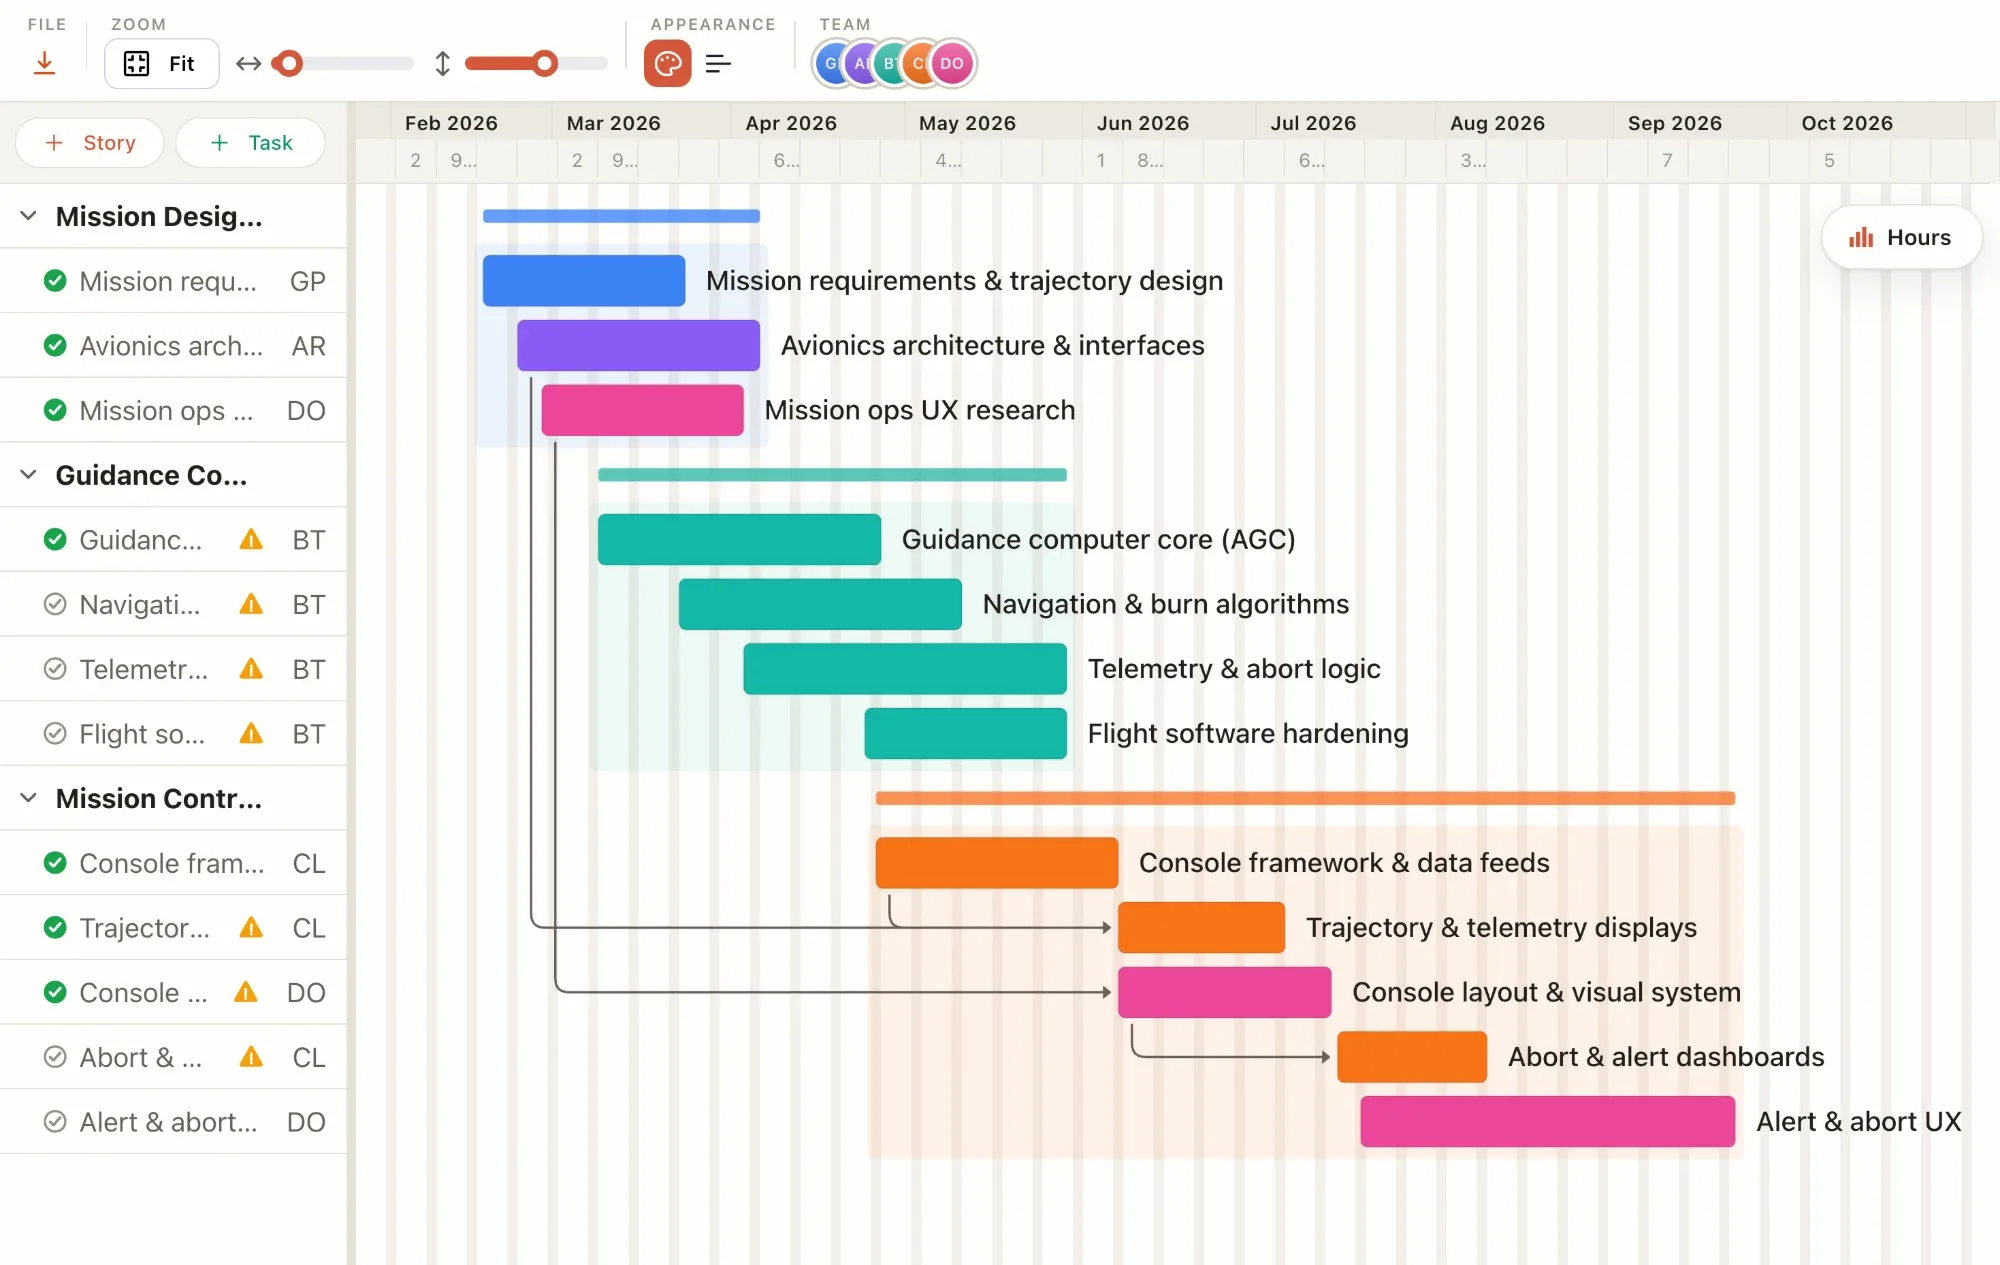
Short answer: Open your chart, choose Export, pick PNG for slides and chat, PDF for print and client sign-off, SVG when someone will edit or scale it, and CSV when you need the data. In EverGantt you can export a Gantt chart as PDF, PNG, SVG, or CSV for free with no account. Below is the step-by-step, the fixes for the three things that usually go wrong (cut-off timelines, blurry images, missing dependency arrows), and a table of which project tools charge for export. Everything was checked on September 22, 2026.
Which format should you export a Gantt chart to?
Pick the format by where the chart is going, not by habit.
- PNG for slides, Slack, email, and docs. It’s a fixed image, so it drops in anywhere and looks the same everywhere. The trade-off is resolution: zoom in far enough and it softens.
- PDF for printing, client sign-off, and anything that gets filed. It’s vector, so text stays crisp at any zoom, and it carries a page size, which matters when someone prints it.
- SVG when a designer will restyle it, when it goes into a web page, or when you want it sharp at any scale. It’s editable in Figma, Illustrator, or a text editor.
- CSV when the receiver wants the numbers, not the picture. It opens straight in Excel or Sheets.
Unsure? PDF. It prints, it zooms, and every reader has something that opens it, so it’s the safe default; add a PNG only if the chart is headed for a deck. (Need a timeline for a research proposal? The research proposal template is built to be exported and pasted into one.)
How to export a Gantt chart for free in EverGantt
Open the free Gantt chart maker, build or paste in your plan, and click Export… in the toolbar above the chart. You don’t need an account for any of this.
- Pick a format. The menu lists PNG (best for presentations), PDF (printable document), SVG (vector, editable), and CSV (spreadsheet data).
- Choose a size. PNG, PDF, and SVG share the same dialog. Size offers Auto (fit chart), A4, A3, A2, A1, US Letter, and three ratios: 16:9, 4:3, and 1:1.
- Decide what to include. Tick “Chart only” to hide the task list and export just the bars, dates, and arrows.
- Pick a theme. Light or Dark, regardless of what you’re looking at on screen.
- Click the PNG, PDF, or SVG button at the bottom of the dialog and the file downloads.
CSV skips the dialog and downloads immediately with one row per task: Story, Task, Start, End, Duration in days, Assignee, Color, and Predecessors. Everything runs in your browser; nothing is uploaded. PNG renders at twice the on-screen size, and PDF pages are landscape at the size you chose.
How do you fit a Gantt chart on one PDF page?
Match the page to the project instead of squeezing a year into A4, and most of the problem goes away.
Two opposite complaints show up in support forums for most tools. Microsoft’s own Q&A has a Project Online user who couldn’t get a long Gantt onto a single PDF page and was told there is no built-in fit. GanttProject’s developer confirms the reverse: it always renders the chart on one page, so long projects come out tiny unless you pick A0 and tile it. TeamGantt’s help suggests shrinking the font or exporting in date-range chunks.
In EverGantt, “Auto (fit chart)” sizes the export to the chart. For a project under six months, A4 landscape is fine. Around a year, A3 reads better. Past that, export PDF or SVG and let the reader zoom; both are vector, so nothing gets blurry. “Chart only” buys extra width by dropping the task list. And if the last row or the right-hand dates are cut off in another tool, landscape orientation is usually the fix, as Kantata’s help page notes for its own PDF.
Why do dependency arrows disappear in a Gantt export?
Because some tools draw the export from a simplified layer that never included them. Kantata’s help page states plainly that dependency arrows are not included in its Gantt PDF, and it points users to HTML export instead. monday.com community threads from 2023 and 2024 report the same thing. Lines visible on screen, gone in the PDF.
That matters because the arrows are the plan. Without them a Gantt chart is a list of colored bars, and the person reading the PDF can’t tell which slip pushes which deadline.
EverGantt builds every export from the same SVG that draws the on-screen chart, arrows included, in both light and dark themes. So PNG, PDF, and SVG all carry the dependency lines. If you only need the arrows for a quick review, “Chart only” gives the bars and lines without the task list beside them.
If your tool drops the arrows, the workaround is a screenshot, which brings back the resolution problem below.
Why is my exported Gantt chart PNG blurry?
A PNG is a grid of pixels sized when you export it. If the tool renders at screen size, the chart looks fine in a doc and soft on a projector. GanttProject’s forum has the textbook example: text pixelated at 2,199 by 898 pixels, and a separate report of a 37,516 by 951 pixel image for a long project that was mostly empty space. Wrike users asked for PDF export for the same reason, calling the PNG blurry and low resolution.
There are two fixes. First, export at higher resolution. EverGantt rasterizes PNG at twice the on-screen size, which is enough for a slide. Second, when the chart will be zoomed or printed large, don’t use PNG at all. Export SVG or PDF. Both are vector, so a bar is a shape rather than pixels and stays sharp at any size. SVG also lets a designer change fonts and colors without redrawing anything.
For a chart headed to a large-format print or a wall, SVG is the right file every time.
How to export a Gantt chart from Excel or Google Sheets
Both work, with limits, and both are free if you already use them.
Excel has no built-in Gantt type; Microsoft’s own guide builds one from a stacked bar chart. To get an image, right-click the chart and choose Save as Picture. Windows offers PNG, JPEG, GIF, TIFF, BMP, and SVG (SVG needs version 1909 or later); Mac offers PNG, JPEG, PDF, GIF, BMP, and SVG. For a PDF, use File, Save As, and choose PDF. Selecting the chart first, or moving it to its own chart sheet, keeps the PDF to the chart.
Google Sheets is simpler. Click the chart, open the three-dot menu, choose Download as, and pick SVG, PNG, or PDF. It’s free and per chart.
The catch is that a spreadsheet Gantt has no real dependencies, so nothing moves when a date changes. If you export from Sheets every week because the plan keeps shifting, that’s a sign the spreadsheet is the bottleneck, not the export.
Which project tools charge for Gantt chart export?
More of them than you’d expect. I checked each vendor’s own help or pricing page on September 22, 2026:
| Tool | Gantt export formats | Free? |
|---|---|---|
| EverGantt | PNG, PDF, SVG, CSV | Yes, no account needed |
| Google Sheets | SVG, PNG, PDF per chart | Yes |
| GanttProject (desktop) | PDF, PNG, HTML; no SVG | Yes, open source |
| Notion | PDF of the page only, no image | Yes, on Free |
| TeamGantt | PDF only | Free plan capped at three PDF exports total |
| Microsoft Project (desktop) | PDF, XPS; GIF via Copy Picture | Paid product; Project for the web has no PDF export |
| Smartsheet | PNG, PDF | Pro plan and up |
| ClickUp | PDF, PNG | Business plan and up, per its help center |
| monday.com | PDF, image (per its help center) | Gantt view itself starts on Standard |
| Jira Plans | PNG | Premium and up |
| Asana | None for Timeline or Gantt; CSV/JSON only | Gantt starts on Starter, and still no visual export |
| Trello | None for Timeline | Timeline is Premium and up |
The list holds two surprises. Asana can’t print or export its Gantt view at any tier; its help page lists Timeline and Gantt among views that don’t support printing. And Trello’s Timeline documentation mentions no export at all. If exporting a chart is part of your weekly routine, check this table before picking a tool, because “has a Gantt view” and “can hand you the chart” are different features.
Should you export in light or dark theme?
Light for anything that might be printed, dark for screens where the rest of the deck is dark.
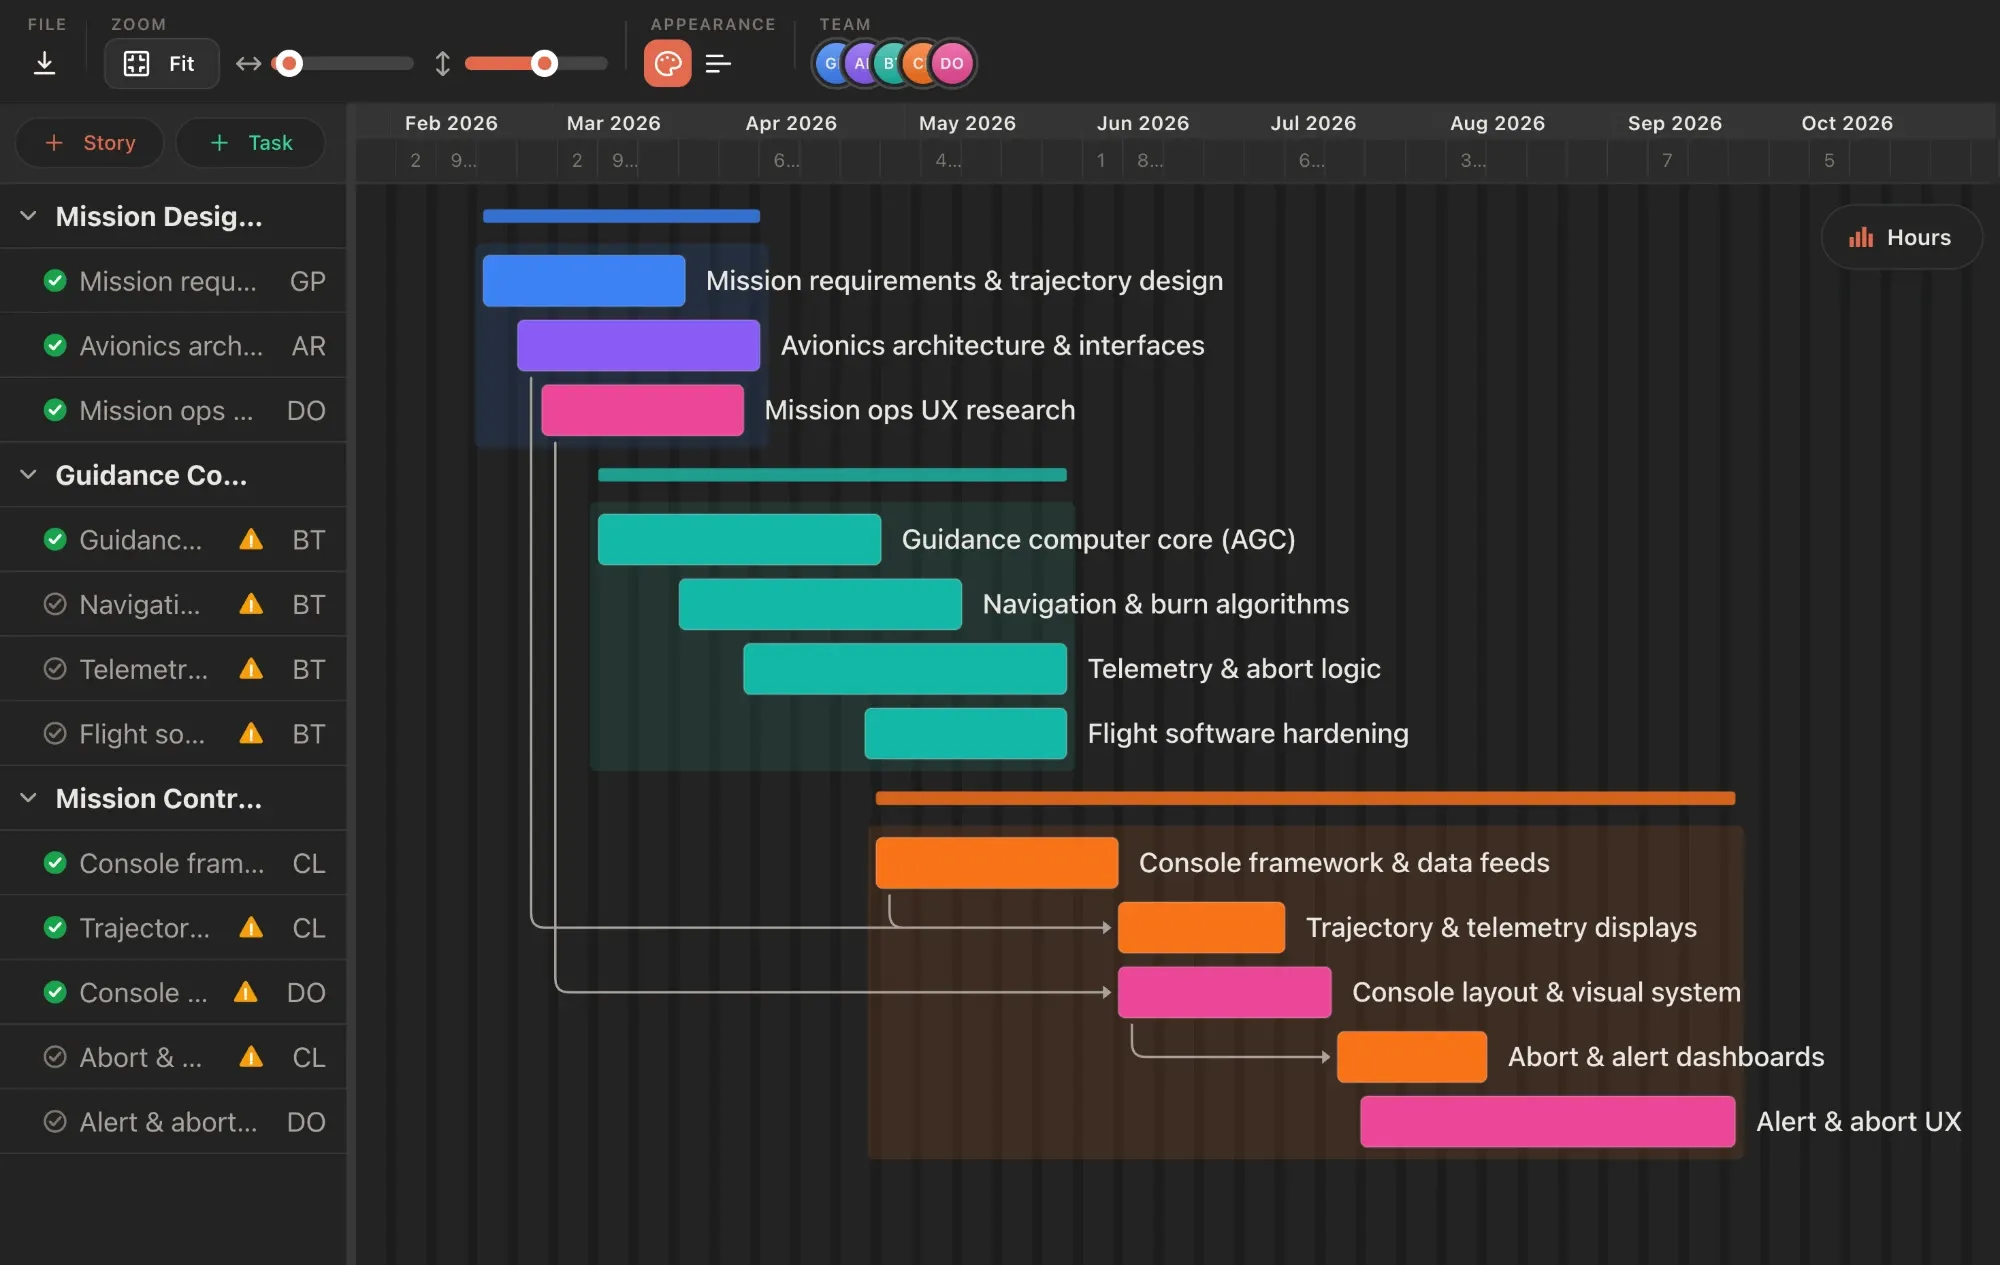
A dark chart on paper burns toner, and pale bars on a dark background can wash out on a cheap printer. Light theme with saturated bars survives a black-and-white print. On screen it’s the reverse: a white chart on a dark slide glares. EverGantt lets you pick Light or Dark in the export dialog for PNG, PDF, and SVG, independent of the theme you’re editing in, so you can keep working in dark mode and still ship a print-friendly PDF.
One more habit worth keeping: export both. A light PDF for the record and a dark PNG for the deck take fifteen seconds and save a re-export later.
Export the chart, then keep the plan alive
Exporting ends a status update. It doesn’t end the plan. People export a Gantt chart every week because the plan changed and the last PDF is stale, which is fine for a client milestone and painful for a team that just needs to know what moved.
If the chart lives in a tool that recalculates when a task slips, the export becomes an occasional artifact instead of a ritual. In EverGantt, building and exporting stay free, no plan required. Saving the plan to the cloud starts at Pro, $3.99 a month for one person. Editing it live with teammates is on Team and Business, and students and nonprofits get any of the three free.
Open the free Gantt chart maker, build the chart, and export it in whichever format the next reader needs.
Vendor export details and plan gating checked on September 22, 2026, on each vendor’s own help or pricing pages. Tell me if one has changed.
Frequently asked questions
Can I export a Gantt chart to PDF for free?
Yes. EverGantt exports PNG, PDF, SVG, and CSV in the browser with no account. Google Sheets downloads any chart as SVG, PNG, or PDF for free. GanttProject exports PDF and PNG free but has no SVG. TeamGantt's free plan allows three PDF exports in total, and ClickUp, Smartsheet, and monday.com put Gantt export on paid plans.
Why are dependency arrows missing from my Gantt chart PDF?
Some tools render the PDF from a simplified layer that leaves out dependency lines. Kantata documents this for its PDF export, and monday.com users report the same in community threads. EverGantt draws the export from the same SVG as the on-screen chart, so arrows come through in PNG, PDF, and SVG.
How do I fit a Gantt chart on one page?
Pick a page size that matches the project length instead of forcing A4. In EverGantt, the Size menu offers Auto (fit chart), A4 through A1, US Letter, and 16:9, 4:3, or square. A one-year project usually reads well on A3 landscape; anything longer, export SVG or PDF, which stay sharp when zoomed.
Why is my exported Gantt chart PNG blurry?
PNG is a fixed grid of pixels, so a chart exported at screen size looks soft when projected or zoomed. EverGantt rasterizes PNG at twice the on-screen size. When you need to zoom or print large, export SVG or PDF instead, since both are vector formats and stay sharp at any size.
Which tools export a Gantt chart as SVG?
As of September 2026: EverGantt (free, no account), Google Sheets (free, per chart), and Excel via Save as Picture (Windows version 1909 or later, and Excel for Mac). GanttProject has no SVG export, and Asana, Trello, monday.com, ClickUp, Smartsheet, and Jira do not offer SVG for their Gantt or timeline views.