
EverGantt

Gantt chart template

Final Year Project Template

This final year project Gantt chart plans an undergraduate project that builds something (software, a device, a design, or an experiment) across two semesters in about 30 weeks: topic and proposal, research and design, two build stages, testing, the report, and the final demo. Every task is linked to the one it waits on, so if the build runs long, you see what it does to your report deadline that day. It opens in your browser with no account needed, and you can export it as a PNG or PDF for your proposal.

14 tasks · 4 phases · about 7 months

Students & research

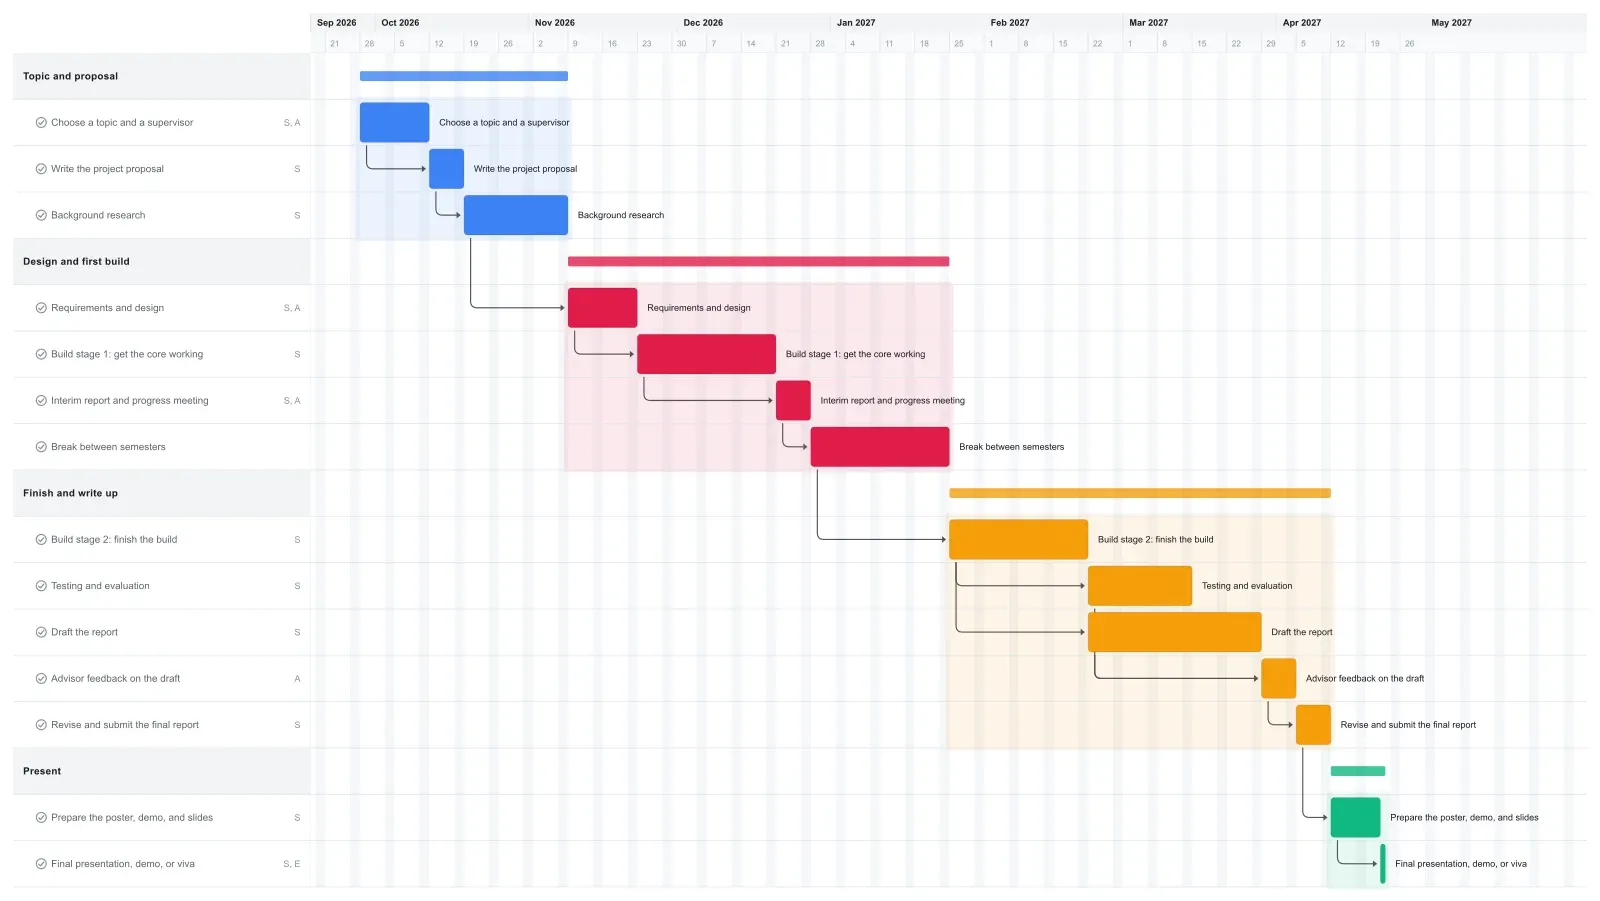
Final Year Project Gantt chart template in EverGantt, light theme

What's in this template

PhaseTaskLengthDepends onWho
Topic and proposal Choose a topic and a supervisor 2 weeks - Student, Advisor
Topic and proposal Write the project proposal 7 days Choose a topic and a supervisor Student
Topic and proposal Background research 3 weeks Write the project proposal Student
Design and first build Requirements and design 2 weeks Background research Student, Advisor
Design and first build Build stage 1: get the core working 4 weeks Requirements and design Student
Design and first build Interim report and progress meeting 7 days Build stage 1: get the core working Student, Advisor
Design and first build Break between semesters 4 weeks Interim report and progress meeting
Finish and write up Build stage 2: finish the build 4 weeks Break between semesters Student
Finish and write up Testing and evaluation 3 weeks Build stage 2: finish the build Student
Finish and write up Draft the report 5 weeks Build stage 2: finish the build Student
Finish and write up Advisor feedback on the draft 7 days Draft the report, Testing and evaluation Advisor
Finish and write up Revise and submit the final report 7 days Advisor feedback on the draft Student
Present Prepare the poster, demo, and slides 10 days Revise and submit the final report Student
Present Final presentation, demo, or viva 1 day Prepare the poster, demo, and slides Student, Examiners

What a realistic final year project timeline looks like

A final year project that builds something often fills the whole academic year, and this final year project Gantt chart runs about 30 weeks: 13 in each semester, with a four-week break between them. Semester 1 is for deciding what to build and getting the core of it working. Semester 2 is for finishing, testing, and writing it up.

Semester 1 gives two weeks to the topic and supervisor, one to the proposal, three to background research, and two to requirements and design. A four-week first build stage leads into the interim report in week 13.

Semester 2 opens with four more weeks of building. Testing then runs alongside the report draft, and your advisor gets the draft at the start of week 27. Testing finishes two weeks before that, so it has some room to run over. After a week of feedback and a week of revisions, the report goes in, and the poster, demo, and final presentation take the last week and a half.

How to adapt this template to your program

Start with your department's deadlines. Set the first task to your first week of term (if term started earlier, drag each phase bar back, first to last), check the interim and final report bars against the real dates, and set the break bar to your university's calendar. A longer break pushes the second semester later. If your break is shorter, drag the Finish phase bar back, then the Present one.

No interim report? Rename that bar to your progress meeting or delete it. If your demo comes before the report deadline, link the poster task to testing instead of the report, then drag the Present phase bar earlier.

On a team capstone project, add a role for each teammate and split the build stages into one bar per person. Students get paid plans at no cost through our student program, and Team lets up to five people edit the chart live. If you're writing a research thesis rather than building something, the thesis template fits better.

Make it yours

Drag the first task to your real start date and everything linked to it moves along. Rename the roles to your people, then export a PNG, PDF, or SVG when you need to share it. No template fits? Start from a blank plan with the project schedule maker. Saving to the cloud starts at Pro; sharing with teammates is on Team and Business.
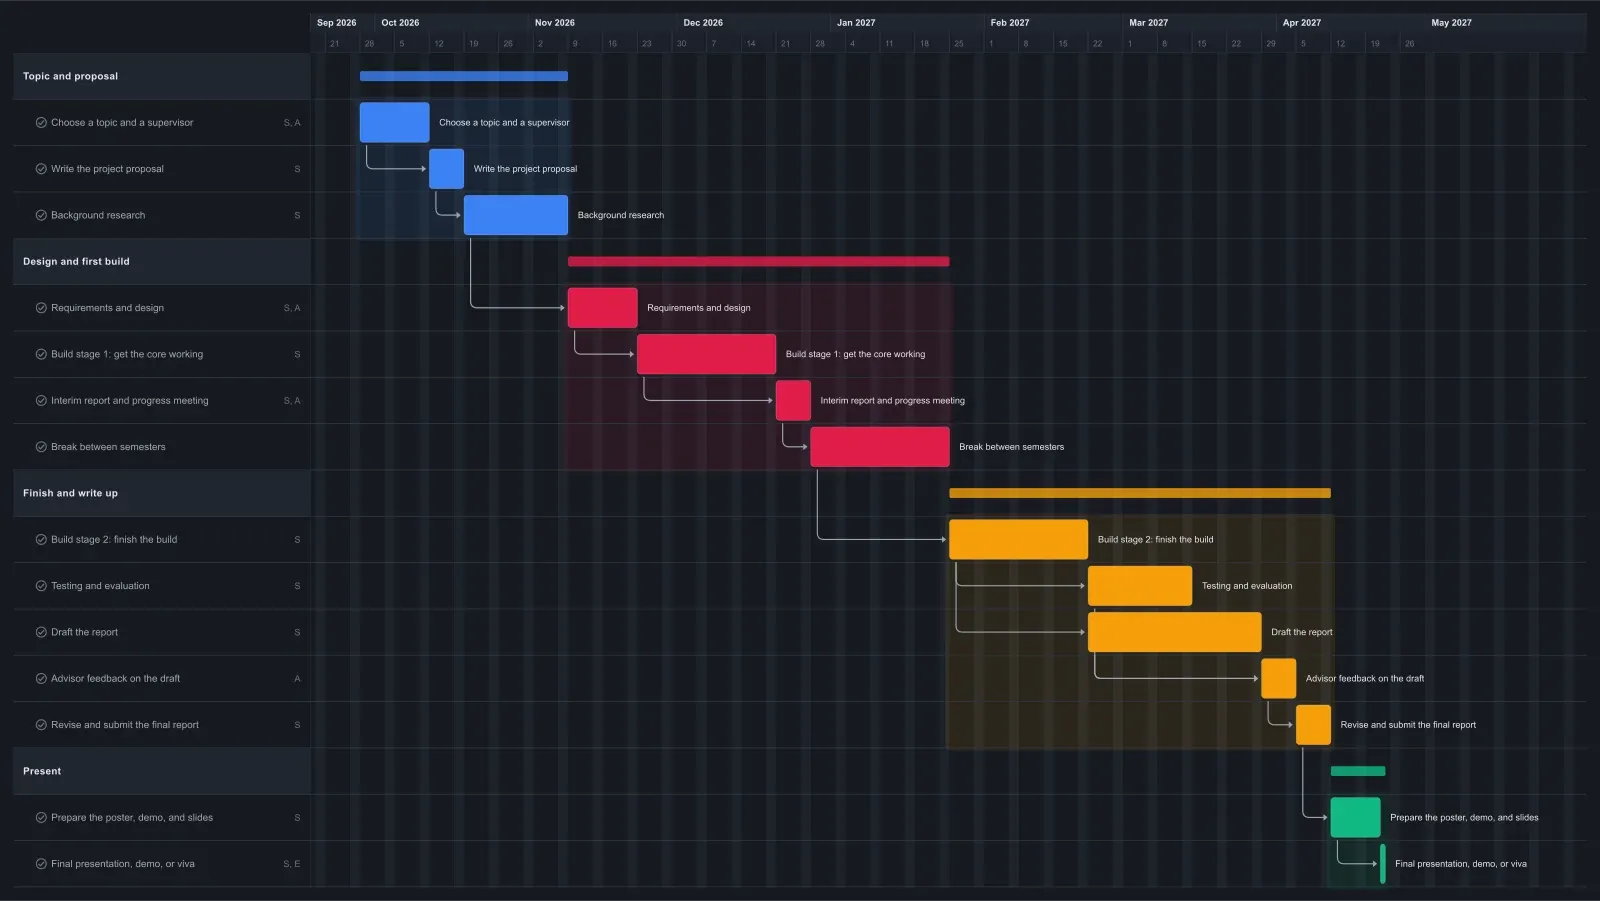
Final Year Project Gantt chart template in EverGantt, dark theme

Frequently asked questions

How long does a final year project take?

Usually a full academic year, though some programs run it in one semester. This template takes about 30 weeks from choosing a topic to the final presentation, including a four-week break. Semester 1 covers the proposal, research, design, and a first working version. Semester 2 covers finishing the build, testing, the report, and the demo.

Should I include a Gantt chart in my project proposal?

Yes, if your proposal or interim report asks for a timeline or work plan. A Gantt chart shows your supervisor the whole plan and its deadlines at a glance. Set this template to your semester dates, export a PNG or PDF, and paste it into the document. Update it and export again for the interim report.

Do I need an account to use this final year project template?

No. The template opens in your browser with no account needed, and you can edit it and export a PNG, PDF, SVG, or CSV. Saving to the cloud and opening the plan from any browser starts at Pro, which is $3.99 a month for one person. See pricing for the details.

Open the Final Year Project template →

Related: How to export a Gantt chart as PNG, PDF, or SVG · Paid plans at no cost for students · What a Gantt chart is actually for (and when you don't need one)

More templates